US States by Population – 2025 Ranking of All 50 States
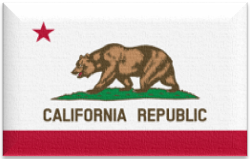
California: Still the Most Populated State
Compare HDI Rankings Over the Years - How HDI is Calculated: Key Indicators Explained
List Od Top 5 Most Populated US States

California
39,663,800

Texas
31,853,800

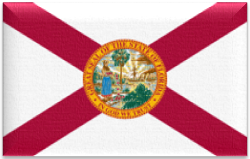
Florida
23,839,600

New York
19,997,100

Pennsylvania
13,139,800
| State | Rank | Population | Change | density |
|---|---|---|---|---|
| California | 1 | 39,663,800 | 0.59% | 255 |
| Texas | 2 | 31,853,800 | 1.80% | 122 |
| Florida | 3 | 23,839,600 | 2% | 445 |
| New York | 4 | 19,997,100 | 0.65% | 424 |
| Pennsylvania | 5 | 13,139,800 | 0.47% | 294 |
| Illinois | 6 | 12,778,100 | 0.53% | 230 |
| Ohio | 7 | 11,942,600 | 0.50% | 292 |
| Georgia | 8 | 11,297,300 | 1.04% | 196 |
| North Carolina | 9 | 11,210,900 | 1.49% | 231 |
| Michigan | 10 | 10,197,600 | 0.56% | 180 |
| New Jersey | 11 | 9,622,060 | 1.28% | 1,308 |
| Virginia | 12 | 8,887,700 | 0.87% | 225 |
| Washington | 13 | 8,059,040 | 1.27% | 121 |
| Arizona | 14 | 7,691,740 | 1.44% | 68 |
| Tennessee | 15 | 7,307,200 | 1.10% | 177 |
| Massachusetts | 16 | 7,205,770 | 0.97% | 924 |
| Indiana | 17 | 6,968,420 | 0.64% | 195 |
| Maryland | 18 | 6,309,380 | 0.74% | 650 |
| Missouri | 19 | 6,282,890 | 0.60% | 91 |
| Colorado | 20 | 6,013,650 | 0.94% | 58 |
| Wisconsin | 21 | 5,991,540 | 0.51% | 111 |
| Minnesota | 22 | 5,833,250 | 0.69% | 73 |
| South Carolina | 23 | 5,569,830 | 1.66% | 185 |
| Alabama | 24 | 5,197,720 | 0.78% | 103 |
| Kentucky | 25 | 4,626,150 | 0.82% | 117 |
| Louisiana | 26 | 4,607,410 | 0.21% | 107 |
| Oregon | 27 | 4,291,090 | 0.44% | 45 |
| Oklahoma | 28 | 4,126,900 | 0.77% | 60 |
| Connecticut | 29 | 3,707,120 | 0.87% | 766 |
| Utah | 30 | 3,564,000 | 1.72% | 43 |
| Nevada | 31 | 3,320,570 | 1.63% | 30 |
| Iowa | 32 | 3,264,560 | 0.71% | 58 |
| Arkansas | 33 | 3,107,240 | 0.61% | 60 |
| Kansas | 34 | 2,989,710 | 0.64% | 37 |
| Mississippi | 35 | 2,942,920 | 0% | 63 |
| New Mexico | 36 | 2,139,350 | 0.43% | 18 |
| Idaho | 37 | 2,032,120 | 1.52% | 25 |
| Nebraska | 38 | 2,023,070 | 0.88% | 26 |
| West Virginia | 39 | 1,769,460 | -0.03% | 74 |
| Hawaii | 40 | 1,450,900 | 0.33% | 226 |
| New Hampshire | 41 | 1,415,860 | 0.48% | 158 |
| Maine | 42 | 1,410,380 | 0.38% | 46 |
| Montana | 43 | 1,143,160 | 0.52% | 8 |
| Rhode Island | 44 | 1,121,190 | 0.80% | 1,084 |
| Delaware | 45 | 1,067,410 | 1.47% | 548 |
| South Dakota | 46 | 931,033 | 0.69% | 12 |
| North Dakota | 47 | 804,089 | 0.94% | 12 |
| Alaska | 48 | 743,756 | 0.49% | 1 |
| Vermont | 49 | 648,278 | -0.03% | 70 |
| Wyoming | 50 | 590,169 | 0.43% | 6 |
Least Populated States in the US - Top 5

Wyoming
590,169

Vermont
648,278

Alaska
743,756

North Dakota
804,089

South Dakota
Understanding the population distribution of US states is key to grasping the nation’s political landscape, economic growth, infrastructure development, and even future trends in education and healthcare. This page presents a comprehensive overview of US states ranked by population, using the latest available data as of 2025, based on sources such as the US Census Bureau and national surveys.
California remains the most populous state in the United States, home to over 39 million people. With its massive tech industry, diverse culture, and favorable climate, it attracts people from all over the country and the world. Texas follows closely, fueled by job opportunities, affordable housing, and major cities like Houston, Dallas, and Austin. Florida continues to grow rapidly, partly due to retirees and tourism-related migration.
On the other end of the spectrum, states like Wyoming, Vermont, and Alaska are among the least populated. While they have vast land areas and natural beauty, their lower populations can be attributed to limited job markets, remote geography, and harsh climates in some cases.
Our list not only gives you the raw population numbers for all 50 states, but it also highlights growth rates, helping you identify which states are booming and which are declining. This information is useful for students, researchers, businesses, and policymakers who rely on demographic trends for planning and analysis.
In addition, the population density (people per square mile) gives another layer of insight—showing states that are crowded versus those that are sparsely populated. This can influence everything from traffic and public services to real estate pricing and political representation.
We’ve also broken down the data regionally—Northeast, South, Midwest, and West—to help users get a clearer picture of how different areas compare. This makes it easier to visualize where population clusters are forming and which regions are gaining influence.
Tags
#USStatesByPopulation #MostPopulatedStates #USPopulation2025 #AmericanStatesRanking #PopulationDensityUSA #CensusData #USDemographics #StatesGrowthRate #Top10USStates #PopulationTrendsUSA
Explore Others Continent
Useful Links – Recommended