Global Literacy Rate by Country – Complete Ranking and Insights
Impact of Literacy on Economy and Society
Introduction to Global Literacy
Top 5 Most Literate Countries

Ukraine
100%
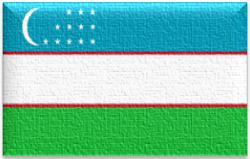
Uzbekistan
100%
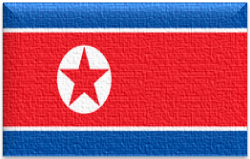
North Korea
100%
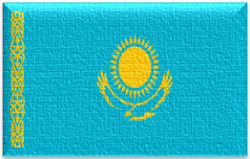
Kazakhstan
100%
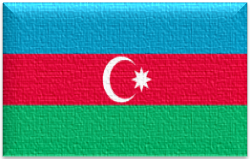
Azerbaijan
100%
| Country | Total Population Literacy Rate | Literacy Rate Male | Literacy Rate Male | Data Year |
|---|---|---|---|---|
| Ukraine | 100% | 100% | 100% | 2021 |
| Uzbekistan | 100% | 100% | 100% | 2022 |
| North Korea | 100% | 100% | 100% | 2015 |
| Kazakhstan | 100% | 99.80% | 99.70% | 2020 |
| Azerbaijan | 100% | 99.90% | 99.70% | 2023 |
| Finland | 100% | |||
| Norway | 100% | |||
| Georgia | 100% | 99.60% | 99.70% | 2022 |
| Luxembourg | 100% | |||
| Guam | 100% | 99.80% | 99.70% | 2000 |
| Andorra | 100% | 100% | 100% | 2016 |
| Greenland | 100% | 100% | 100% | 2015 |
| Liechtenstein | 100% | |||
| Belarus | 99.90% | 99.90% | 99.90% | 2019 |
| Latvia | 99.90% | 99.90% | 99.90% | 2021 |
| Estonia | 99.90% | 99.90% | 99.90% | 2021 |
| San Marino | 99.90% | 99.90% | 99.90% | 2022 |
| Poland | 99.80% | 99.80% | 99.80% | 2021 |
| Tajikistan | 99.80% | 99.80% | 99.70% | 2015 |
| Armenia | 99.80% | 99.80% | 99.70% | 2020 |
| Lithuania | 99.80% | 99.80% | 99.80% | 2021 |
| Russia | 99.70% | 99.70% | 99.70% | 2021 |
| Cuba | 99.70% | 99.60% | 99.70% | 2021 |
| Turkmenistan | 99.70% | 99.80% | 99.60% | 2015 |
| Slovenia | 99.70% | 99.70% | 99.70% | 2015 |
| Kyrgyzstan | 99.60% | 99.70% | 99.50% | 2019 |
| Moldova | 99.60% | 99.70% | 99.50% | 2021 |
| Barbados | 99.60% | 99.60% | 99.60% | 2014 |
| Croatia | 99.40% | 99.70% | 99.20% | 2021 |
| Cyprus | 99.40% | 99.60% | 99.20% | 2021 |
| Tonga | 99.40% | 99.40% | 99.50% | 2021 |
| Italy | 99.20% | 99.40% | 99% | 2018 |
| Hungary | 99.10% | 99.10% | 99.10% | 2021 |
| Fiji | 99.10% | 99.10% | 99.10% | 2018 |
| Samoa | 99.10% | 99% | 99.30% | 2021 |
| United States | 99% | |||
| Japan | 99% | |||
| Germany | 99% | |||
| United Kingdom | 99% | |||
| Argentina | 99% | 98.90% | 99.10% | 2018 |
| Netherlands | 99% | |||
| Sweden | 99% | |||
| Czech Republic | 99% | 99% | 99% | 2011 |
| Serbia | 99% | 99.90% | 99.10% | 2019 |
| Ireland | 99% | |||
| New Zealand | 99% | |||
| Mongolia | 99% | 99.10% | 99.20% | 2020 |
| Albania | 99% | 98.70% | 98.20% | 2022 |
| Montenegro | 99% | 99.40% | 98.50% | 2021 |
| Antigua and Barbuda | 99% | 98.40% | 99.40% | 2015 |
| Romania | 98.90% | 99.10% | 98.70% | 2021 |
| Cayman Islands | 98.90% | 98.70% | 99% | 2021 |
| South Korea | 98.80% | 99.20% | 98.40% | |
| Uruguay | 98.80% | 98.50% | 99% | 2019 |
| Spain | 98.60% | 99% | 98% | 2020 |
| Grenada | 98.60% | 98.60% | 98.60% | 2014 |
| Taiwan | 98.50% | 99.70% | 97.30% | 2014 |
| Jordan | 98.40% | 98.70% | 98.40% | 2021 |
| Bulgaria | 98.40% | 98.70% | 98.20% | 2021 |
| North Macedonia | 98.40% | 99.10% | 97.60% | 2020 |
| Marshall Islands | 98.30% | 98.30% | 98.20% | 2011 |
| United Arab Emirates | 98% | 98.80% | 97.20% | 2022 |
| Palestine | 98% | 98.80% | 96.20% | 2022 |
| Costa Rica | 98% | 98% | 98.10% | 2021 |
| Bosnia and Herzegovina | 98% | 99.40% | 98.10% | 2022 |
| Bahrain | 98% | 99.90% | 94.90% | 2022 |
| Trinidad and Tobago | 98% | 99.20% | 98.70% | 2000 |
| Aruba | 98% | 97.80% | 97.80% | 2020 |
| Greece | 97.90% | 98.50% | 97.40% | 2018 |
| Maldives | 97.90% | 97.60% | 98.40% | 2021 |
| Israel | 97.80% | 98.70% | 96.80% | 2011 |
| Saudi Arabia | 97.60% | 98.60% | 96% | 2020 |
| Brunei | 97.60% | 98.30% | 96.90% | 2021 |
| Venezuela | 97.50% | 97.40% | 97.70% | 2022 |
| Singapore | 97.50% | 98.90% | 96.10% | 2020 |
| Macau | 97.10% | 98.50% | 95.90% | 2021 |
| China | 97% | 98.50% | 95.20% | 2020 |
| Chile | 97% | 97.10% | 97% | 2022 |
| Saint Vincent and the Grenadines | 97% | 1980 | ||
| American Samoa | 97% | 1980 | ||
| New Caledonia | 96.90% | 97.30% | 96.50% | 2015 |
| Turkey | 96.70% | 99.10% | 94.40% | 2019 |
| Palau | 96.60% | 96.80% | 96.30% | 2015 |
| Kuwait | 96.50% | 97.10% | 95.40% | 2020 |
| Philippines | 96.30% | 95.70% | 96.90% | 2019 |
| Indonesia | 96% | 97.40% | 94.60% | 2020 |
| Portugal | 95.90% | 97.80% | 95.90% | 2021 |
| Seychelles | 95.90% | 95.40% | 96.40% | 2020 |
| Vietnam | 95.80% | 97% | 94.60% | 2022 |
| Oman | 95.70% | 97% | 92.70% | 2022 |
| Panama | 95.70% | 98.80% | 95.40% | 2019 |
| Colombia | 95.60% | 95.40% | 95.90% | 2020 |
| Dominican Republic | 95.50% | 95.40% | 95.60% | 2022 |
| Equatorial Guinea | 95.30% | 97.40% | 93% | 2015 |
| Mexico | 95.20% | 96.10% | 94.50% | 2020 |
| South Africa | 95% | 95.50% | 94.50% | 2021 |
| Malaysia | 95% | 96.20% | 93.60% | 2019 |
| Lebanon | 95% | 96.90% | 93.30% | 2019 |
| Suriname | 95% | 96.50% | 93.40% | 2021 |
| Malta | 94.90% | 93.40% | 96.40% | 2021 |
| Sao Tome and Principe | 94.80% | 96.50% | 91.10% | 2022 |
| Brazil | 94.70% | 94.40% | 94.90% | 2022 |
| Peru | 94.50% | 97% | 92% | 2020 |
| Paraguay | 94.50% | 94.90% | 94.20% | 2020 |
| Thailand | 94.10% | 95.50% | 92.80% | 2021 |
| Bolivia | 94% | 94.90% | 94% | 2020 |
| Ecuador | 93.90% | 94.90% | 93.10% | 2022 |
| Qatar | 93.50% | 92.40% | 94.70% | 2017 |
| Puerto Rico | 92.40% | 92.40% | 92.40% | 2021 |
| Sri Lanka | 92.30% | 93% | 91.60% | 2022 |
| Namibia | 92.30% | 90.60% | 92.30% | 2021 |
| Mauritius | 92.20% | 93.50% | 90.50% | 2021 |
| Libya | 91% | 96.70% | 85.60% | 2015 |
| Cape Verde | 90.80% | 94.20% | 87.40% | 2022 |
| El Salvador | 90% | 91.30% | 87.30% | 2020 |
| Guyana | 90% | 89.30% | 88.40% | 2022 |
| Ivory Coast | 89.90% | 93.10% | 86.70% | 2019 |
| Zimbabwe | 89.70% | 88.30% | 89.70% | 2021 |
| Myanmar | 89.10% | 92.40% | 86.30% | 2019 |
| Vanuatu | 89.10% | 89.80% | 88.40% | 2021 |
| Iran | 89% | 92.40% | 88.70% | 2022 |
| Eswatini | 89% | 88.30% | 88.50% | 2020 |
| Jamaica | 88.70% | 84% | 93.10% | 2015 |
| Honduras | 88.50% | 88.20% | 88.70% | 2019 |
| Botswana | 88.50% | 88% | 88.90% | 2015 |
| Laos | 88% | 91.40% | 81.40% | 2022 |
| Zambia | 86.70% | 90.60% | 83.10% | 2020 |
| Syria | 86.40% | 91.70% | 81% | 2015 |
| Gabon | 86% | 86.20% | 84.70% | 2022 |
| Iraq | 85.60% | 91.20% | 79.90% | 2017 |
| Guatemala | 84% | 87.70% | 79.30% | 2022 |
| Cambodia | 84% | 88.40% | 79.80% | 2022 |
| Kenya | 83% | 85.50% | 79.80% | 2022 |
| Nicaragua | 83% | 82.40% | 82.80% | 2015 |
| Tunisia | 82.70% | 89.10% | 82.70% | 2021 |
| Tanzania | 82% | 85.50% | 78.20% | 2022 |
| Lesotho | 82% | 81% | 72.90% | 2022 |
| Algeria | 81.40% | 87.40% | 75.30% | 2018 |
| DR Congo | 81% | 89.50% | 70.80% | 2022 |
| Belize | 81% | 2001 | ||
| Republic of the Congo | 80.60% | 85.90% | 75.40% | 2021 |
| Ghana | 80% | 83.50% | 74.50% | 2020 |
| Uganda | 79% | 84% | 74.30% | 2021 |
| Cameroon | 78% | 2020 | ||
| Madagascar | 77.30% | 78.80% | 75.80% | 2022 |
| Morocco | 77% | 84.80% | 67.40% | 2022 |
| Solomon Islands | 77% | 1999 | ||
| Eritrea | 76.60% | 84.40% | 68.90% | 2018 |
| India | 76% | 82.40% | 65.80% | 2022 |
| Burundi | 76% | 81.30% | 68.40% | 2022 |
| Rwanda | 75.90% | 78.70% | 73.30% | 2021 |
| Bangladesh | 74.90% | 77.80% | 72% | 2020 |
| Egypt | 73.10% | 78.80% | 67.40% | 2022 |
| Angola | 72% | 2022 | ||
| Bhutan | 72% | 77.90% | 62.80% | 2022 |
| Nepal | 71.20% | 81% | 63.30% | 2021 |
| Yemen | 70.10% | 85.10% | 55% | 2015 |
| Timor-Leste | 68.10% | 71.90% | 64.20% | 2020 |
| Malawi | 68% | 71.20% | 63.70% | 2022 |
| Mauritania | 67% | 71.80% | 62.20% | 2021 |
| Togo | 66.50% | 80% | 55.10% | 2019 |
| Papua New Guinea | 64.20% | 65.60% | 62.80% | 2015 |
| Mozambique | 63.40% | 74.10% | 53.80% | 2021 |
| Nigeria | 62% | 71.30% | 52.70% | 2018 |
| Comoros | 62% | 67% | 56.90% | 2022 |
| Haiti | 61.70% | 65.30% | 58.30% | 2016 |
| Sudan | 60.70% | 65.40% | 56.10% | 2018 |
| Gambia | 59% | 65.20% | 51.20% | 2022 |
| Pakistan | 58% | 69.30% | 46.50% | 2019 |
| Senegal | 58% | 68.40% | 45.40% | 2022 |
| Guinea-Bissau | 52.90% | 67% | 39.90% | 2022 |
| Ethiopia | 51.80% | 57.20% | 44.40% | 2017 |
| Sierra Leone | 48.60% | 56.30% | 41.30% | 2022 |
| Liberia | 48.30% | 62.70% | 34.10% | 2017 |
| Benin | 47% | 56.90% | 35% | 2022 |
| Burkina Faso | 46% | 54.50% | 37.80% | 2021 |
| Guinea | 45.30% | 61.20% | 31.30% | 2021 |
| Somalia | 41% | 2022 | ||
| Niger | 38% | 45.80% | 29% | 2022 |
| Central African Republic | 37.50% | 49.20% | 26.20% | 2020 |
| Afghanistan | 37.30% | 52.10% | 22.60% | 2021 |
| South Sudan | 34.50% | 40.30% | 28.90% | 2018 |
| Mali | 31% | 46.20% | 25.70% | 2020 |
| Chad | 27% | 35.40% | 18.20% | 2022 |
Top 5 Countries With the Lowest Literacy Rates

27%

Mali
31%
South Sudan
34.5%
Afghanistan
37.3%
CAR
37.5%
Literacy is more than just the ability to read and write—it’s the foundation of personal empowerment and national development. In today’s information-driven world, literacy opens the doors to better jobs, health, and social participation. Understanding literacy rates by country provides insights into education systems, economic conditions, and cultural priorities.
As of 2025, global literacy rates continue to improve, but the progress is uneven. While countries like Norway, Finland, Japan, and South Korea boast literacy rates close to 100%, several developing nations in Sub-Saharan Africa and South Asia still struggle with basic education access, particularly for girls and rural communities.
In many nations, especially developed ones, literacy is not just about reading and writing anymore. Digital literacy is becoming equally important as the world shifts to online learning, remote jobs, and internet-based communication. Countries that prioritize educational innovation and inclusiveness tend to perform well in literacy rankings.
Education inequality remains a major concern. Gender disparity still exists in some regions, with women and girls having limited access to school. Moreover, conflict zones and economically fragile countries suffer the most setbacks in literacy growth.
Organizations like UNESCO and UNICEF work globally to enhance access to quality education. Initiatives such as Education for All aim to ensure that every child, regardless of their background, gets the opportunity to become literate.
This webpage offers a detailed view of the current literacy rates by country, how these rates have changed over time, and what countries are doing to improve them. You’ll find charts, global maps, and sortable tables to help you compare data from different regions and periods.
Improving literacy is not just a national issue; it’s a global responsibility. Countries that invest in education see returns in the form of economic growth, reduced poverty, healthier citizens, and more active democracies. Literacy empowers people to think critically, engage in society, and pursue lifelong learning.
Whether you’re a researcher, student, policymaker, or simply curious, this resource will help you understand the current state of global literacy, its challenges, and the hope for a more educated future.
#LiteracyRate #GlobalLiteracy #EducationStatistics #MostLiterateCountries #UNESCO #WorldLiteracyRanking #CountryByCountryLiteracy #EducationalDevelopment #LiteracyTrends2025 #GenderGapInEducation #DigitalLiteracy #YouthLiteracy #AdultLiteracy
Sources: